Data Drifting Monitor in Azure
In order to capture suspicious data from external sources, we usually define a set of rules, that explicitly examine upcoming data and validate the data against those rules. What happens if the data still looks good and stays within defined frames and schemas, but something is smelly?
Classic approach
Let's consider the case of a company that tracks the estate market changes. If the volume of the data that comes from an external data provider rumps down, or values break their banks, then it is easy to capture that breach by introducing validation rules. For example, If a price of an estate is bigger than 100M$ or lower than zero, then such input data (like a file) should be rejected or fixed, before processing. The business users maybe not be happy with some delay, but still ... it's better to be safe than sorry.

Data Drifts ML
To capture such behaviour we may use Machine Learning mechanisms. One of those could be the Azure ML Dataset Monitor service, which is a part of the Azure Machine Learning product. Let's see how to cause a stir.
- Define the base dataset - the range of health data, we want to take as reference and compare with new data update
- Define the target dataset - the range of data we want to compare with the base dataset (usually including last updates)
- Define a Drift Magnitude threshold - if it's exceeded, then raise an alert to whom concerned (support, business users,....)
- Create scheduler - Define how often we want to run our monitor to compare the updated target data set with the reference base dataset.
How does it work? First, we need to create a base data set - the reference data load that we trust and want to use to compare with the next loads. We need also to create a target data set that will contain the new (potentially suspicious) information. The target dataset will have to be updated every time before the analysis has been executed (see Azure Synapse or Azure Data Factory). Once is defined, we can run the analysis ad-hoc by simple pressing the Analyse Existing Data button. We can also set up the scheduler (Daily, weekly, monthly...), to run the analysis independently.
Once executed, the Auto ML magic takes place, and crunch the fields' values ( columns as features) and trying to assess how much the features have been changed, scoring drift points.
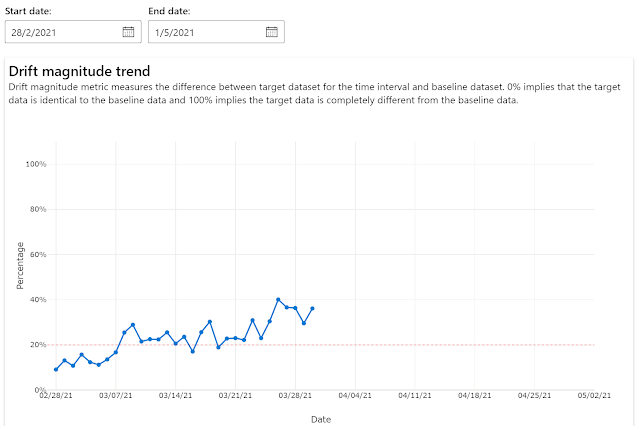
What do you get?
The Magnitude Drift. It's a value will a single number that expresses the drifting impact. Zero says, that the base dataset and target data set are the same. The 100 points mean, that both data sets look completely different. If the value exceeds the established threshold (example: 40% points) that the system is capable to send notifications about such a situation (including Application Insight... so, we can do anything we want :) ).

Individual field (feature) assessment. This is the level of detail you may value most! The Drift Monitor will tell you how a particular field (aka feature) has been changed during the time.

Summary
I like this tool because of one more reason. One of the biggest challenges I usually face in my projects is a lack of understanding of the data. It makes a difficult to assess the quality of the data and its dynamics. The drift monitor, executed ad-hoc, lets me do an initial check and easily capture an anomaly, despite my limited domain knowledge.
To get started please request your free Azure Account credit (200$) and try to run your first Azure ML Drift Monitor. It's really easy to set up and it made my day.
Source of the image photo pexels.com


Comments
Post a Comment